


Stop Guessing. Start Seeing
How to detect stress early?
6/12/2025
How Multispectral Drones Detect Turf Stress Early
Maintaining elite playing conditions across greens, fairways, and rough isn't just about mowing stripes and watering deeply. Turf stress builds up quietly—beneath the canopy, beneath your radar. But not beneath ours.
At PhytoMaps, we use multispectral drone imaging to help golf course superintendents detect, map, and respond to stress before it shows—saving you time, money, and face when it matters most.
What Is Turf Stress—and Why Early Detection Matters
Turfgrass reacts to everything: too much water, too little water, compaction, fungal disease, overuse, winterkill—you name it. But here’s the catch: by the time symptoms are visible, you're already behind.
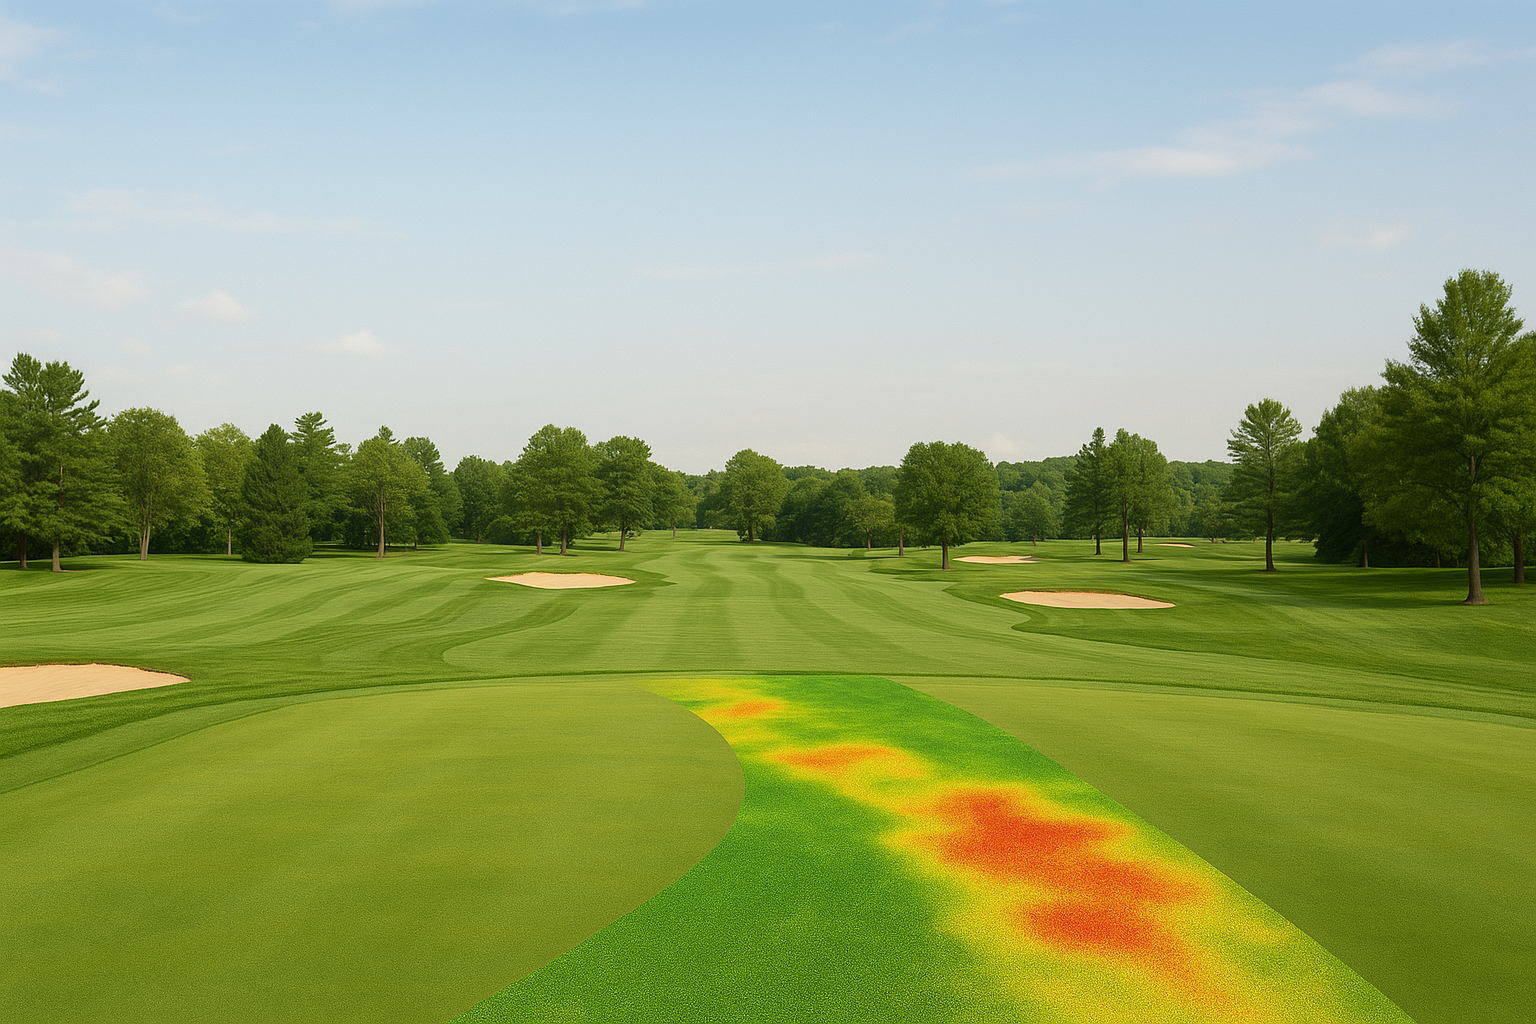
Multispectral sensors read how turf reflects light in key bands (red, red-edge, near-infrared) to spot the early signs of stress—like reduced chlorophyll or disrupted water transport—days or even weeks before visible symptoms appear.
How It Works: Multispectral Imaging in Action
We fly high-resolution drones equipped with industry-standard sensors that capture multiple wavelengths of light. These readings are then converted into maps and indices that show turf health in real terms.
Key tools we use:
NDVI (Normalized Difference Vegetation Index): Measures vigor by comparing red and NIR reflectance. Lower NDVI values = stressed turf.
NDRE (Red Edge Index): A chlorophyll-sensitive metric great for early-stage detection and high-maintenance zones like greens.
Thermal overlays (optional): Identify hot spots from irrigation failures or compaction.
Real-World Applications for Your Course
Here's how PhytoMaps transforms raw data into results:
1. Early Stress Detection
Detect water stress, fungal outbreaks, or nutrient issues before the turf turns yellow or thins out.
2. Irrigation Performance
Pinpoint underperforming sprinklers or drainage problems by comparing uniformity across zones.
3. High-Precision Interventions
Focus fungicides, fertilizers, and labor only where they’re needed—no more blanket applications.
4. Track Recovery & Treatment
Compare weekly or monthly flights to see if treatments are working. No guesswork, just visual proof.
5. Turf Health Mapping Made Simple
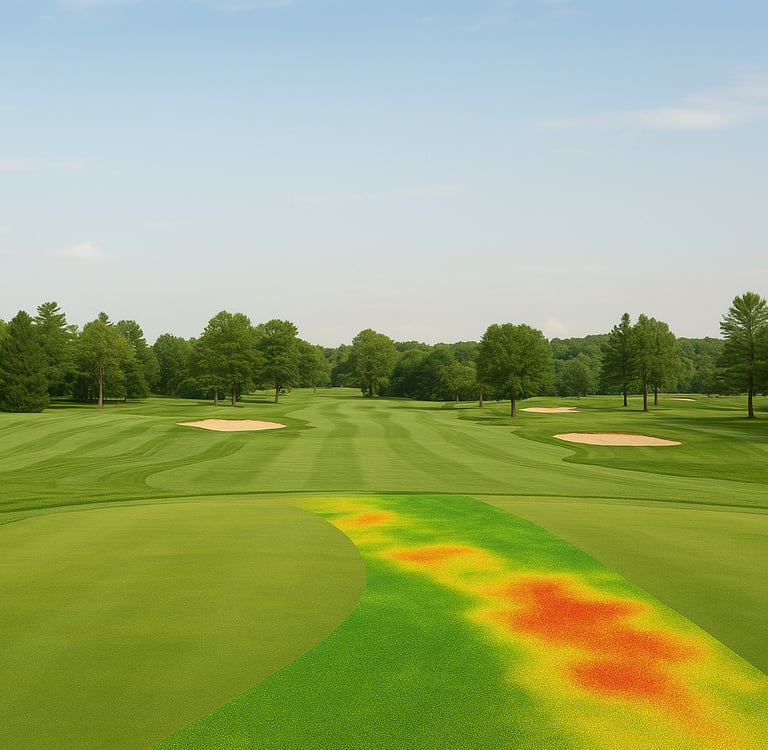
We break your course into clear zones—greens, fairways, tees, and rough—and assign health scores to each. You'll get intuitive, color-coded stress maps:
🟢 Healthy turf
🟡 Watch zones
🔴 Immediate action areas
This helps you plan your day’s work before even stepping foot on the course.
The PhytoMaps Edge
Fast turnaround: Get your turf health maps within 24 hours of flight.
No training needed: We fly, analyze, and deliver.
Custom reporting: Geo-tagged insights, tailored to your course layout.
Ready to See the Invisible?
Your turf is already sending signals. PhytoMaps helps you read them—from the sky down.
Contact us today to schedule a demo or learn how our drone-based turf insights can give your course a competitive edge.